Open Block vs. Closed Block: Med Supp Rate Changes in 2025 & 2026

The distinction between open and closed blocks matters enormously for actuarial assessment. Open block carriers price competitively to attract new members, giving them a constantly refreshed pool of relatively healthier, recently-enrolled individuals. Closed block carriers, by contrast, face a steadily aging and self-selected pool with no new entrants to dilute claims experience. The conventional expectation has long been that closed block rates should rise faster. What's happening in 2025 and 2026 is challenging that assumption — and this analysis examines the data behind the shift.
Looking Back:
To understand where the market is in 2025 and 2026, it's useful to trace the trajectory from 2020 forward. The six-year arc tells a story of post-pandemic stabilization giving way to a slow acceleration, followed by a sharp repricing event starting in 2024.
In 2020 and 2021, rate increases in both the open and closed blocks hovered in the 4–6% range. The closed block was actually the higher of the two in 2020 (6% vs. 42%) and 2021 (5% vs. 3%), consistent with the adverse selection dynamic typical of closed books. As healthier members age out of the Medigap market or switch plans, the remaining pool in a closed block trends toward older, sicker, and more expensive enrollees — pushing claims, and therefore required rates, higher.
The years 2022 and 2023 were a period of near-parity. Healthcare utilization patterns normalized after the disruptions of the pandemic, and both blocks hovered around 4–5%. The spread between open and closed blocks narrowed to near-zero in 2022 (CB: 4%, OB: 4%), then remained tight in 2023 (CB: 5%, OB: 5%). Carriers on both sides of the open/closed divide were filing modestly and the market, on the surface at least, appeared relatively stable.
The shift began in 2024. Both blocks accelerated together — CB rose to 7% and OB to 7% — and for the first time, the open block edged marginally ahead. That marginal lead became a meaningful gap in 2025, and by 2026 has widened to 3.2 percentage points. The inversion of the historical pattern — open block now outpacing closed.
2025 Year Review
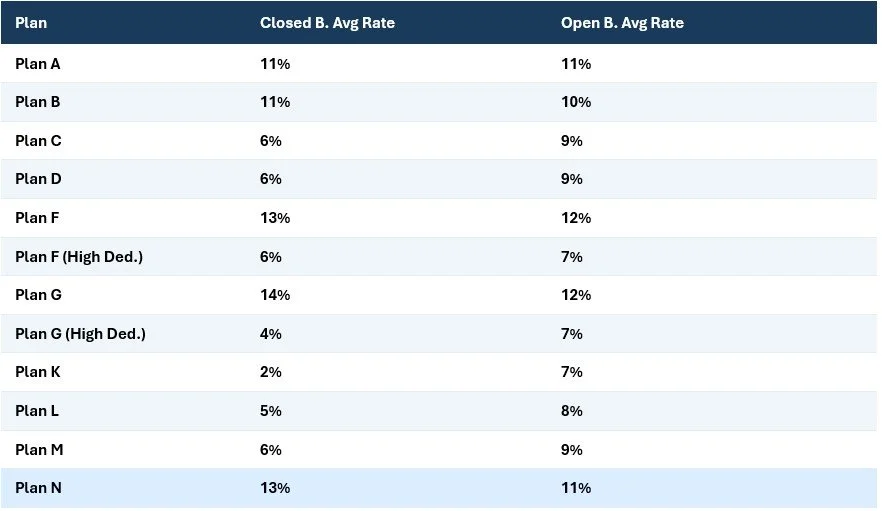
Both open and closed block averages crossed 10% for the first time in this dataset, arriving nearly simultaneously at nearly identical levels: 10.75% for closed block and 10% for open block. For the practical purpose of assessing market direction, 2025 is a year in which both blocks repriced at roughly the same pace. The distribution of rate changes tells a remarkably similar story for both blocks. In the closed block, 48% of all plan-level filing observations showed a rate increase exceeding 10%. In the open block, the corresponding figures were 46% above 10%. This reinforces the sense that 2025 was a year of broadly shared market-wide pressure, rather than a block-specific repricing event.
2026 (Thus Far)
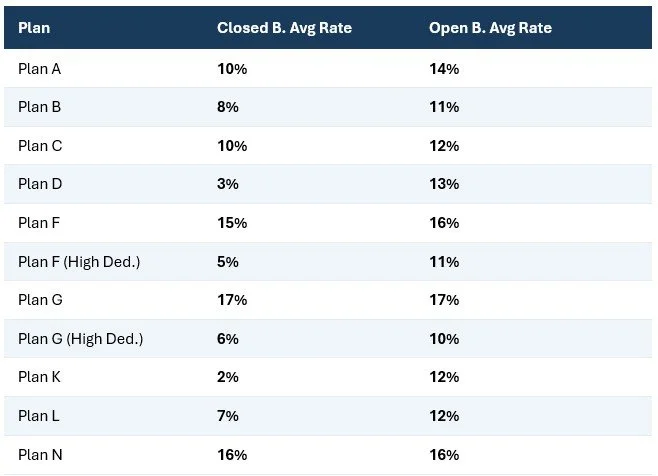
The open block average has climbed to 14%, while the closed block has moved to 11%. A gap of 3.2 percentage points may sound modest, but it represents a meaningful structural shift when viewed against six years of data in which the two blocks rarely diverged by more than a point, and when the direction of that divergence was historically the opposite.
The median figures are particularly revealing. For the open block, the median plan-level increase in 2026 is 14% — almost exactly matching the mean, which indicates a distribution that is relatively tight and symmetric around the upper-double-digit range. For the closed block, the median is just 9% — a full 2.4 points below its mean, indicating a more right-skewed distribution where a smaller number of high-increase filings are pulling the average up while the central tendency remains below 10%. These are fundamentally different distribution shapes, not just different central values.
In 2026, nearly 70% of all open block plan-level filings show a rate increase exceeding 10%. For closed block, that figure is 43%.
Unlike 2025, where open and closed blocks traded leadership across different plan letters, in 2026 the open block leads on almost every plan. The gap is particularly pronounced on Plans D, K, F_High, and G_High — plans with cost-sharing features — where open block increases range from 9% to 13% while closed block figures sit in the 2% to 6% range. This suggests that closed block carriers are, at least thus far in 2026, taking a more measured approach to repricing their cost-sharing plan variants, perhaps reflecting more favorable claims experience in those specific segments.